Panama City Beach Real Estate Market Reports

Ongoing market analysis for Panama City Beach, Panama City, and 30A covering condominiums, single-family homes, and pricing trends.

main secondary

Panama City Beach Condominium Market Reports

Panama City Beach condominiums represent one of the most dynamic segments of the local real estate market. This report tracks pricing trends, inventory levels, sales activity, and buyer behavior across beachfront and resort-oriented properties.
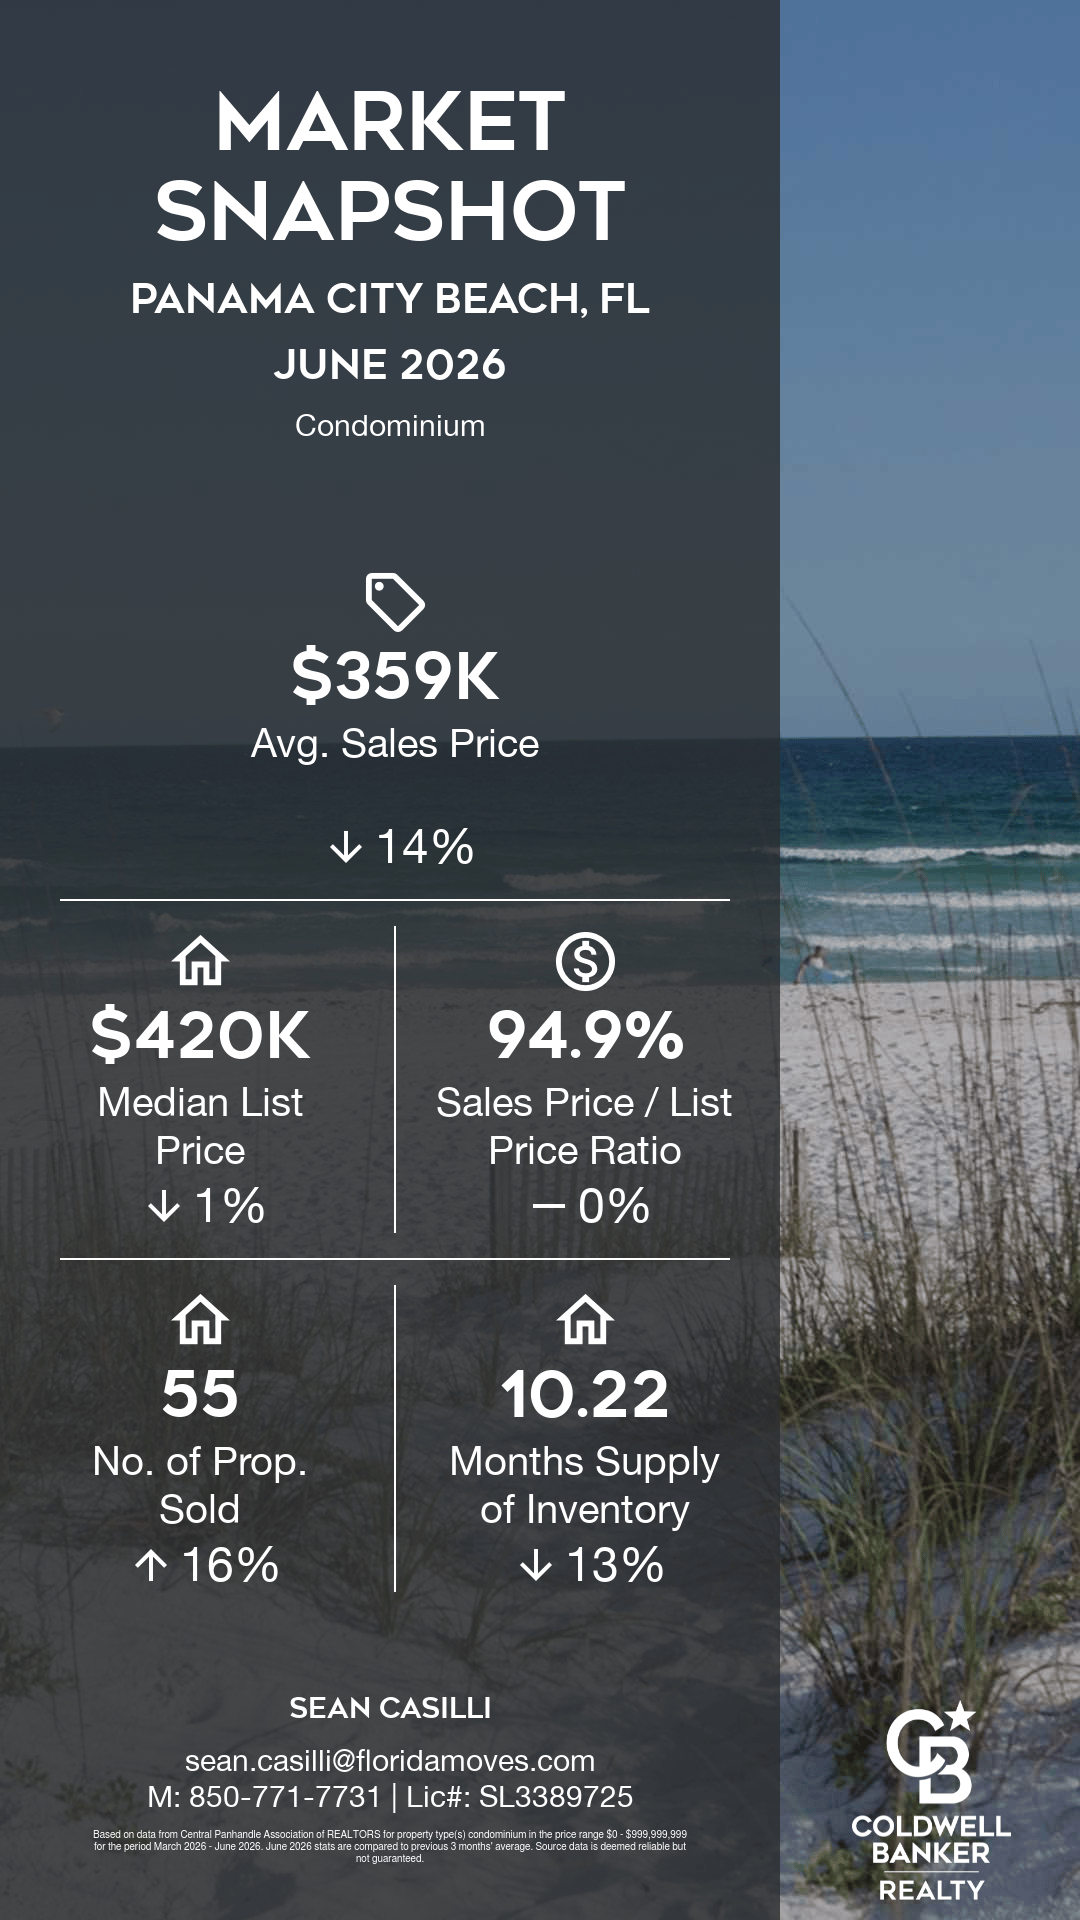
May 2026 Market Snapshot

In May 2026, condominiums in Panama City Beach, FL recorded an average sales price of $446K, representing a 10% increase compared to the prior period. The median list price for Panama City Beach, FL condominiums was $430K, reflecting a 0% change, while the sales price to list price ratio closed at an average of 95.2% of list price, also reflecting a 0% change. A total of 45 properties sold during May 2026, representing a 6% decrease compared to the prior period. Inventory expanded to 12.47 months of supply, reflecting a 4% increase. Overall, the Panama City Beach, FL condominium market showed higher average sales pricing, stable median list pricing, stable sales price to list price performance, fewer closed sales, and expanded condominium inventory compared to the prior period.

Explore Panama City Beach Condominiums

Jump to Panama City Beach Condominium Market Report Archive

main secondary

Panama City Beach Single-Family Home Market Reports

The Panama City Beach single-family home market includes primary residences, second homes, and investment properties throughout the coastal corridor. This report tracks pricing trends, sales activity, negotiation patterns, and inventory levels to provide a clear view of current conditions.

May 2026 Market Snapshot

In May 2026, single-family homes in Panama City Beach, FL recorded an average sales price of $558K, representing a 20% decrease compared to the prior period. The median list price for Panama City Beach, FL single-family homes was $625K, reflecting a 2% increase, while the sales price to list price ratio closed at an average of 96.9% of list price, reflecting a 0% change. A total of 70 properties sold during May 2026, representing a 4% increase compared to the prior period. Inventory tightened to 5.43 months of supply, reflecting a 4% decrease. Overall, the Panama City Beach, FL single-family home market showed lower average sales pricing, higher median list pricing, stable sales price to list price performance, increased closed sales, and reduced inventory compared to the prior period.

Explore Panama City Beach Single-Family Homes

Jump to Panama City Beach Single-Family Market Report Archive

main secondary

Panama City Single-Family Home Market Reports

The Panama City single-family home market reflects a broader residential mix, including established neighborhoods, waterfront communities, and new construction. This report tracks pricing movement, sales volume, and inventory trends to provide a clear view of overall market balance.

May 2026 Market Snapshot

In May 2026, single-family homes in Panama City, FL recorded an average sales price of $392K, representing a 6% increase compared to the prior period. The median list price for Panama City, FL single-family homes was $359K, reflecting a 0% change, while the sales price to list price ratio closed at an average of 97.4% of list price, also reflecting a 0% change. A total of 173 properties sold during May 2026, representing a 9% increase compared to the prior period. Inventory remained at 5.21 months of supply, reflecting a 0% change. Overall, the Panama City, FL single-family home market showed higher average sales pricing, stable median list pricing, stable sales price to list price performance, increased closed sales, and unchanged inventory compared to the prior period.

Explore Panama City Single-Family Homes

Jump to Panama City Single-Family Market Report Archive

main secondary

30A Single-Family Home Market Reports

The 30A single-family home market reflects one of the highest price segments along the Emerald Coast. This report tracks pricing movement, sales activity, and inventory trends across detached homes throughout the 30A corridor.

May 2026 Market Snapshot

In May 2026, single-family homes in ZIP Code 32461 recorded an average sales price of $3.18 million, representing a 22% increase compared to the prior period. The median list price for ZIP Code 32461 single-family homes was $2.12 million, reflecting a 0% change, while the sales price to list price ratio closed at an average of 96.2% of list price, also reflecting a 0% change. A total of 51 properties sold during May 2026, representing a 10% increase compared to the prior period. Inventory tightened to 6.51 months of supply, reflecting an 11% decrease. Overall, the ZIP Code 32461 single-family home market showed higher average sales pricing, stable median list pricing, stable sales price to list price performance, increased closed sales, and reduced inventory compared to the prior period.

Explore 30A Single-Family Homes

Jump to 30A Single-Family Market Report Archive

How We Analyze the Market

Our market reports are based on data from the local Multiple Listing Service (MLS) and reflect closed sales, active listings, and pricing trends within each defined segment. Metrics including average sales price, median list price, sales-to-list ratio, closed volume, and months of inventory are reviewed to assess overall market balance.

Each report is structured to provide clarity rather than prediction. By tracking consistent indicators month over month, buyers and property owners can better understand pricing direction, negotiation dynamics, and inventory shifts across Panama City Beach, Panama City, and 30A.

Historical reports and video breakdowns are available within each market segment for deeper review.

Let’s Talk

Strategic representation for buyers and sellers across Panama City Beach, Panama City, and 30A. Connect with The Real Experts to discuss your next move.

Follow Us on Instagram